API HealthCheck Dashboard
Overview
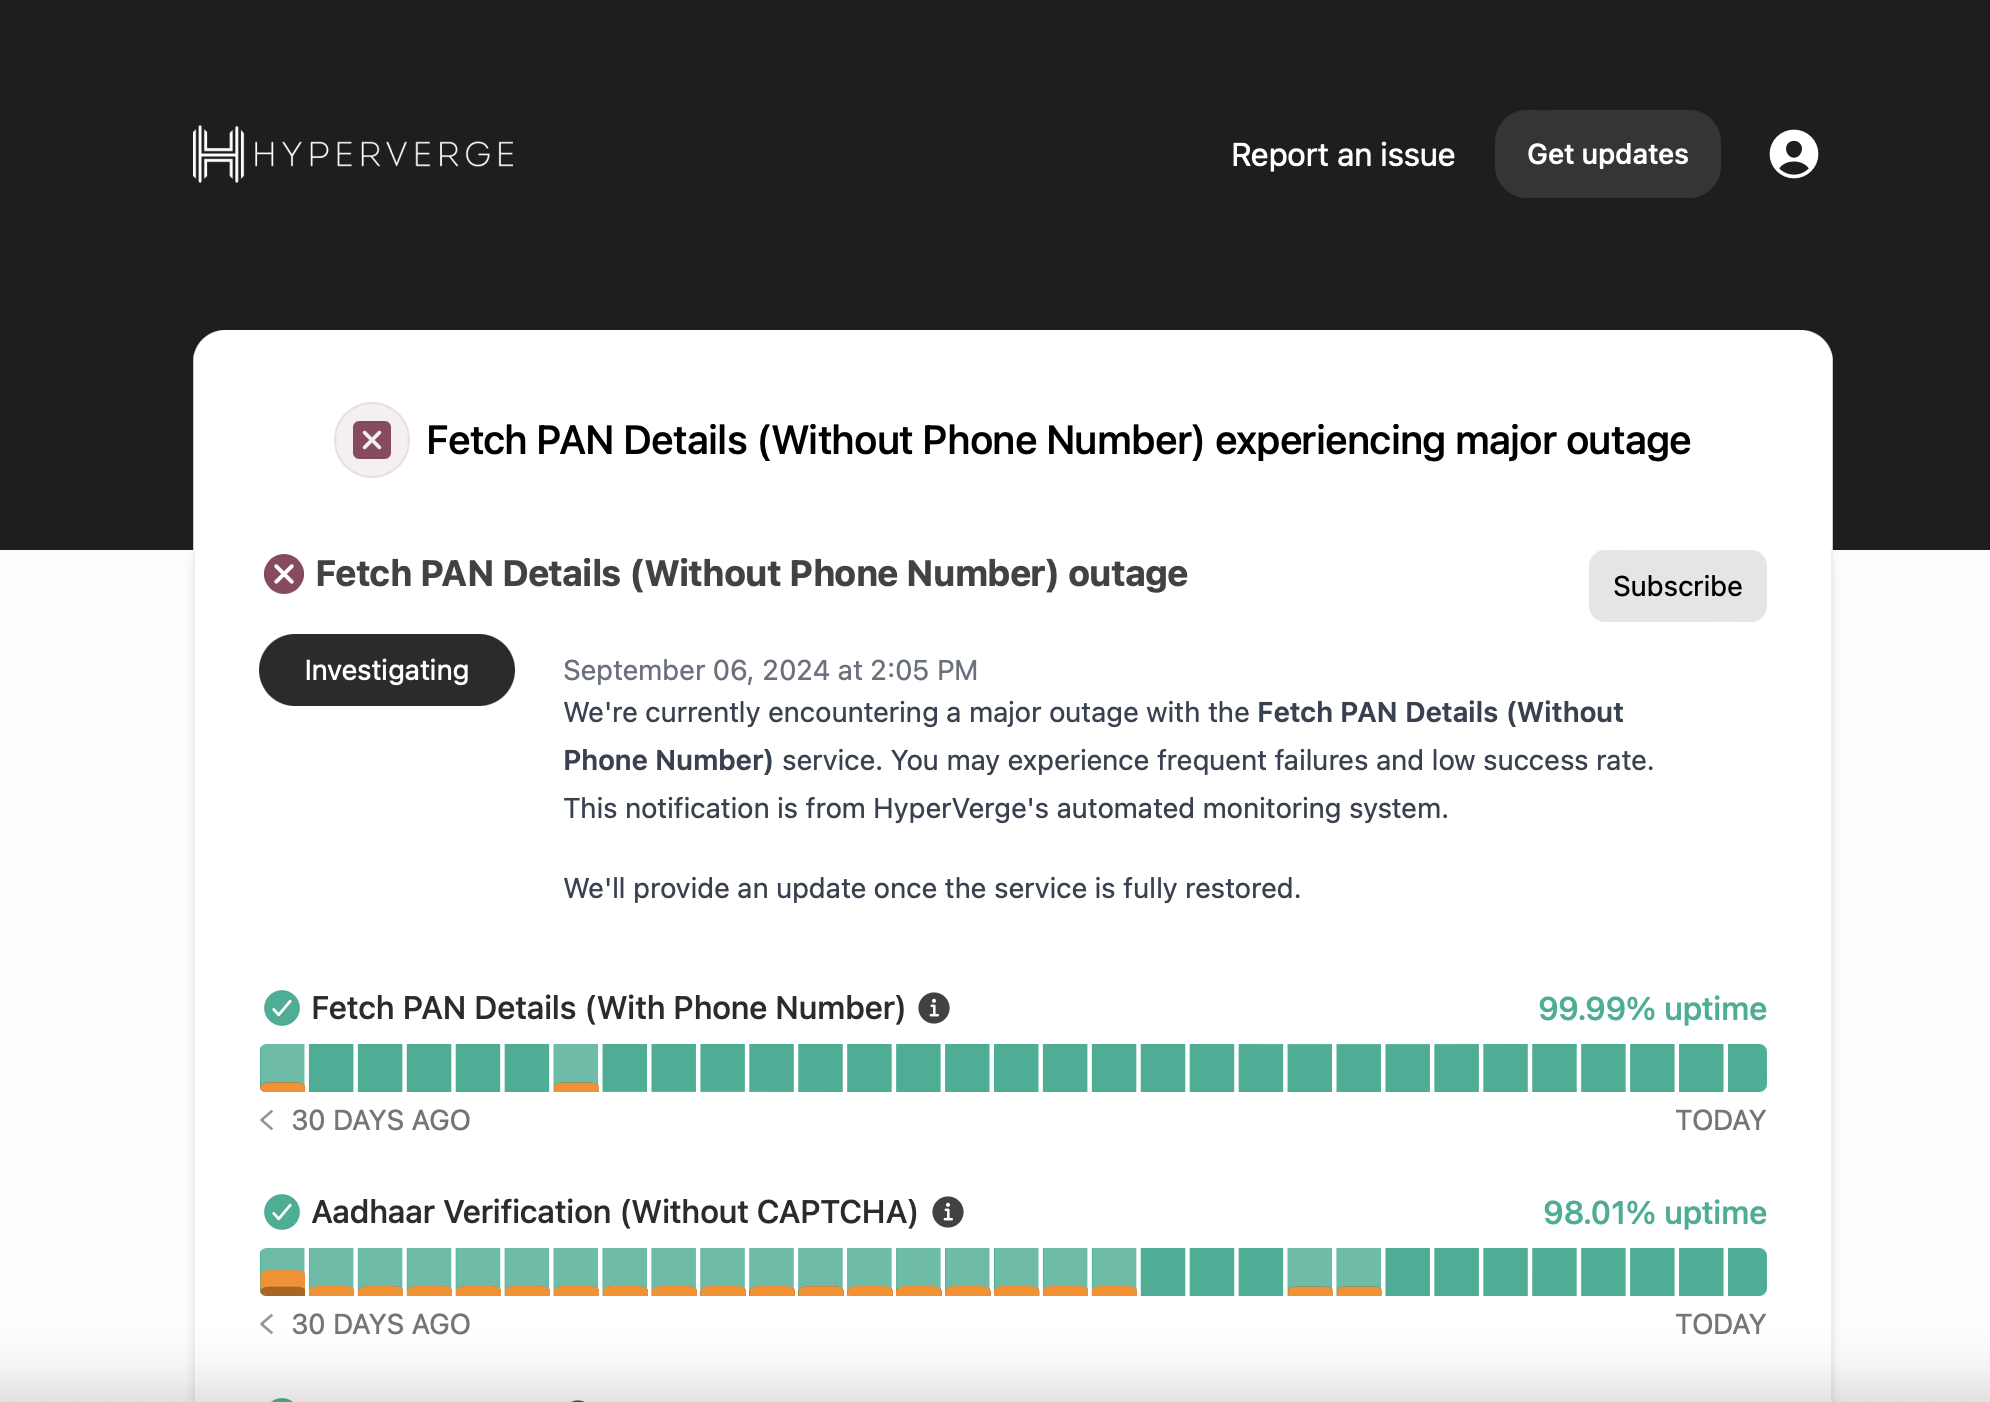
This guide covers the API Uptime/Healthcheck Dashboard — used to view API performance and send automated alerts to clients during performance degradation.
Dashboard URL: https://ind.hvstatus.co/
Problem
Failing to send timely alerts to clients during vendor downtime was a major pain point in NPS surveys, likely to worsen with new vendors in the API marketplace.
Solution
The API Healthcheck Dashboard provides:
- Monitor API performance historically
- Monitor API performance in real-time
- Send automated alerts to clients during outages
- Send automated alerts once service is operational
- Send communication regarding scheduled downtime
- Configure alerts for APIs specific to a client based on usage
- Configure client email IDs for notifications
Default thresholds: 20% error rate in 5 minutes (configurable per API).
Access by User Type
| User Type | Access Flow |
|---|---|
| Platform Clients | HV One Dashboard → Dev Hub → API Health → Select Country → Dashboard Opens |
| Non-Platform Clients | Credentials generated in backend → Client login → Access via CTA in emails |
| HV Members | Login via HV email credentials |
One-time login to HV Dashboard is mandatory to access the downtime dashboard. After that, it can be accessed via CTA in emails.
The Dashboard: Deep Dive
Understanding Downtime Thresholds
The dashboard provides a high-level view of API uptime but does not reflect precise real-time accuracy.
Example: If we set a performance threshold of 80% for an API:
- Performance drops below 80% → dashboard shows downtime
- Performance above 80% (even at 90%) → dashboard shows 100% uptime
Components
| Component | Use Case |
|---|---|
| Instatus | Communication platform to display uptime and enable client subscriptions |
| Pingdom | Service that calls healthcheck APIs to detect if a service is up or down |
| Healthcheck API | API that monitors endpoints and triggers notifications based on failure percentage |
Playbook
Calculating Thresholds and Min Volume
Steps to calculate threshold:
- Identify a day where actual downtime occurred
- Analyze API calls per minute and failure percentage within a fixed interval (e.g., 5 or 10 minutes)
- If failure percentage usually stays below 30%, set 30% as the threshold
- Define downtime as failures exceeding the threshold for more than the fixed interval
Steps to calculate min volume:
- Analyze API call volumes during low-traffic periods (nighttime)
- Calculate average volume within the fixed interval
- Establish minimum volume threshold — traffic below this level is not considered for downtime detection
FAQs
Q: How many APIs are currently supported? A: Currently 26, with plans to scale to top 50.
Q: How far back can we access data? A: As far back as needed, but accurate historical data starts from June 2024.